
The sequencing of genomes — human genomes as well as those of model organisms, like the fruit fly Drosophila melanogaster — has given us deep insight into the structure of chromosomes and their nucleotide sequences. But long before DNA sequencing technology existed, researchers were able to use mutant genes to create high-quality chromosome maps for D. melanogaster. This post explains how you can construct a Drosophila chromosome map in the lab today.
Chromosome maps are based on patterns of homologous recombination, or “crossing over”
During prophase of meiosis 1, the chromatids of homologous chromosomes engage in recombination of DNA, or “crossing over.” Homologous recombination is an evolutionarily conserved process designed to increase the genetic diversity of gametes.

Although the process of recombination is fundamentally random, genes that are further apart on the chromosome are more likely to be recombined — therefore, if you calculate the rate of recombination between two genes, you can estimate their physical distance on the chromosome. This basic concept is the basis of gene mapping on a chromosome.
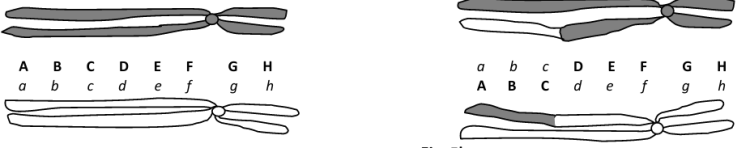
Imagine a pair of homologous chromosomes where one chromosome carries only dominant alleles for genes a through h (A, B, C, etc.) while its homologous partner carries only recessive alleles of the same genes: a, b, c, etc. (see left panel below). Following a crossover event between genes C and D (right panel below), some dominant and recessive alleles have been exchanged between the two chromosomes. This will lead to more genetic diversity in the resulting gametes.
Creating a chromosome map
In the diagram below, the distance between alleles A and B is twice that between B and C. Therefore, we would expect recombination between A and B to occur roughly twice as often as between B and C.

Below is an example D. melanogaster chromosome carrying 3 recessive mutant alleles: b, cn, and vg, which relate to body color, eye color, and wing size, respectively. Let’s say the flies are heterozygous for these alleles, meaning the homologous chromosome carries dominant alleles of each gene. If these heterozygous flies are then crossed to homozygous recessive flies — and no homologous recombination takes place — we would expect 50% of the offspring to have black bodies, cinnabar eyes, and vestigial wings, and the other 50% to have the typical wild-type phenotype based on the typical random segregation of alleles.

But as we know, crossing over between homologous chromosomes does take place, and the percentages in the above diagram indicate in how many of the resulting offspring the respective allele pairs have been exchanged: the b and vg alleles are recombined in 17% of offspring, compared to 8% and 9% for the b–cn and cn–vg allele pairs, respectively. These percentages are also called map units, and represent the physical distances between genes/alleles on the chromosome. By tabulating the crossover rates between mutant alleles, you can then infer the map unit distances between those genes on a chromosome. And that’s how to create a Drosophila melanogaster chromosome map!
If you enjoyed this summary of how to create a Drosophila chromosome map, check out our post about how Drosophila genes are named.